
Strava fake stats: how every number on a run adds up
Your buddy posts a 6-mile run at 7:30 in the morning, and you start wondering about Strava fake stats. Clean map, steady pace, a nice bit of climbing. 😏
So how are those numbers even built? Every stat on an activity comes from somewhere, and when they don’t match, people notice fast.
Good news: SimuRun builds every stat from one route you draw on a map. No sweat, no watch, no spreadsheet.
In this guide, you’ll see:
- what each number on a Strava run really means,
- why most fake Strava activity attempts look off,
- how to get stats that add up with SimuRun,
- and where the fun ends (spoiler: leaderboards).
Lace up your imagination. Let’s go 🏃
Strava fake stats: what are we talking about?
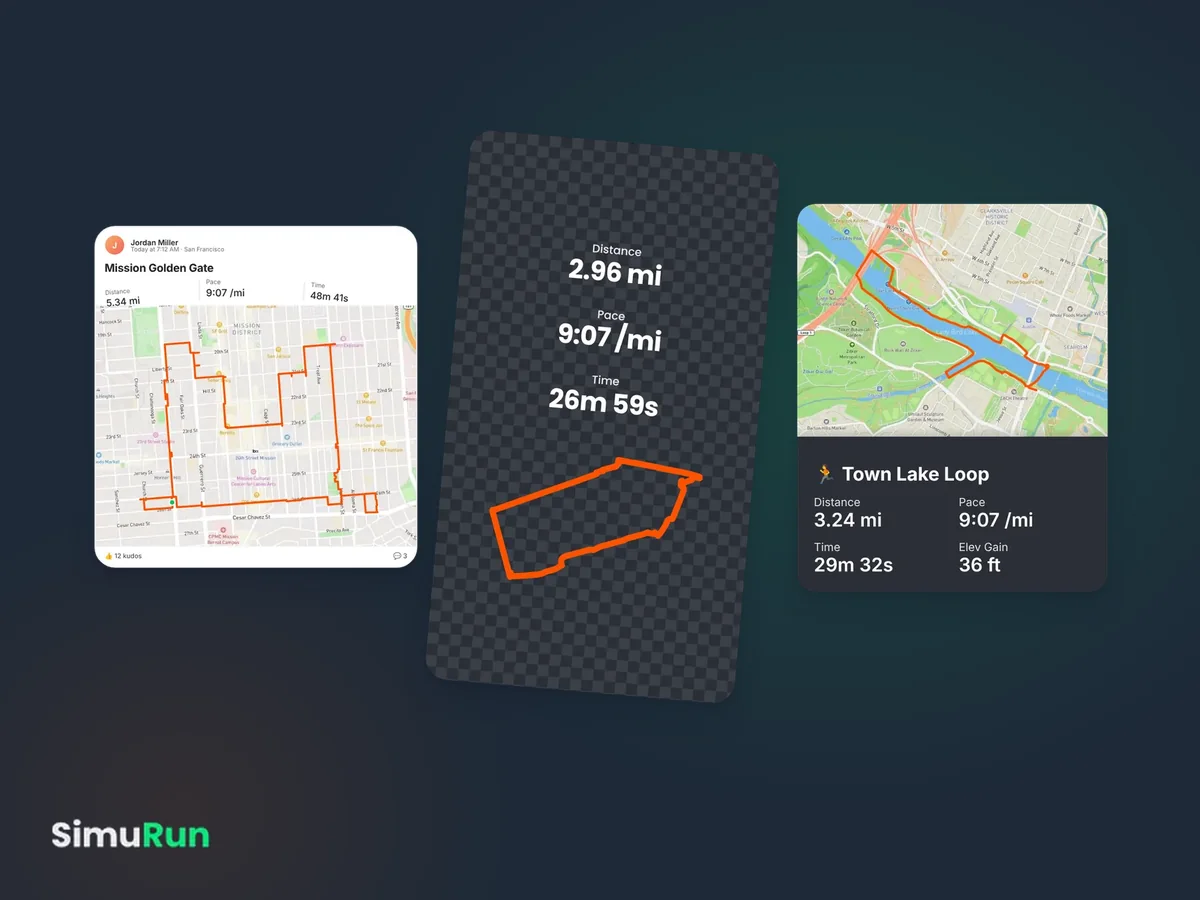
Strava fake stats are the numbers of a run that never happened. Distance, time, pace, elevation gain, maybe heart rate.
Except they don’t come from a GPS watch. They come from a simulated GPX file that you upload like any other workout.
👉 Think movie special effects, but for your training log.
Fake stats vs. a manual entry
Sure, Strava already lets you log a workout by hand. You type a distance and a time, and that’s it.
The catch? A manual entry has no map, no route, and no story.
As a result, it looks exactly like what it is.
A GPX file, on the other hand, is different. It carries GPS points with timestamps, so the app can draw your route and compute the rest.
Who actually wants this? More people than you’d think.
- App and watch testers who need a clean file without going outside.
- Content creators who want a nice activity for a video or a post.
- GPS art fans who draw shapes instead of chasing PRs 🎨
- Pranksters who love a running joke (pun fully intended).
What they all want is the same thing: a run that reads like a normal Tuesday run. Not a glitch, not a world record.
The numbers behind every run, one by one
Before you fake anything, you need to know how the numbers talk to each other. Here’s the cheat sheet. Well, the non-cheating sheet 😇
Spoiler: Strava fake stats only look real when they all come from the same route. Change one number on its own, and the others stop making sense.
1. Distance: the length of your line
First, distance is simply the length of your route on the map. Draw a longer line, get a longer run.
In other words, distance isn’t something you type. It’s the result of your route.
2. Time: start, finish, and everything between
Next, each GPS point has a timestamp. The gap between the first and the last one gives the duration.
Also, the start time matters.
A run at 5 in the morning says discipline. A run at 2 in the morning says plot twist.
3. Pace: the stat everyone checks first
Basically, pace is time divided by distance. In the US, you’ll read it in minutes per mile.
Here’s the thing: Real runners don’t hold the exact same pace for 6 miles. They slow down on hills and fade at the end.
That’s why a perfectly flat pace line looks like a robot went for a jog 🤖
4. Elevation gain: the hills you “climbed”
Elevation gain is the total of every climb along your route. It depends on where your route goes, not on a setting.
So you want more climbing? Then pick a hillier route. That’s how it works in real life, and that’s how it works in SimuRun.
5. Heart rate: optional, but telling
Finally, heart rate only shows up if the file contains it. A file with an average around 130 bpm suggests an easy effort.
⚠️ On Strava, heart rate from uploaded files stays hidden until you allow it in your privacy settings.
Why so much fake Strava activity looks fake
Here’s where most homemade attempts fall apart. Not because people are bad at it, but because the numbers don’t agree with each other.
And your running group has seen a lot of runs. Trust us, they’ll notice 👀
The route cuts through buildings
Click random points on a map and connect them with straight lines.
Congrats, you just ran through three apartment buildings and a parking garage 🏢
In contrast, a believable route follows real streets and trails.
The pace is way too perfect
For starters, every mile at 9:07 on the dot? Nobody runs like that. Metronomes, maybe. Humans, no.
The stats don’t match the map
For instance, a hilly neighborhood with almost zero elevation gain. A short loop with a marathon time. These are the details people spot in two seconds.
Editing a file by hand is pure pain
Of course, you can open a GPX file in a text editor. It’s just XML: points, times, and elevations.
But shifting hundreds of timestamps by hand? Hard pass.
That’s an afternoon gone. One typo can break the whole file 😵
👉 Bottom line: Good fake stats start with one coherent route, and everything else is computed from it.
How to build Strava fake stats with SimuRun
Now for the easy way. SimuRun is a fake running app that works right in your browser, and every number comes from the route you draw.
Here’s exactly how it works right now, from blank map to GPX file.
Step 1: draw your route 🗺️
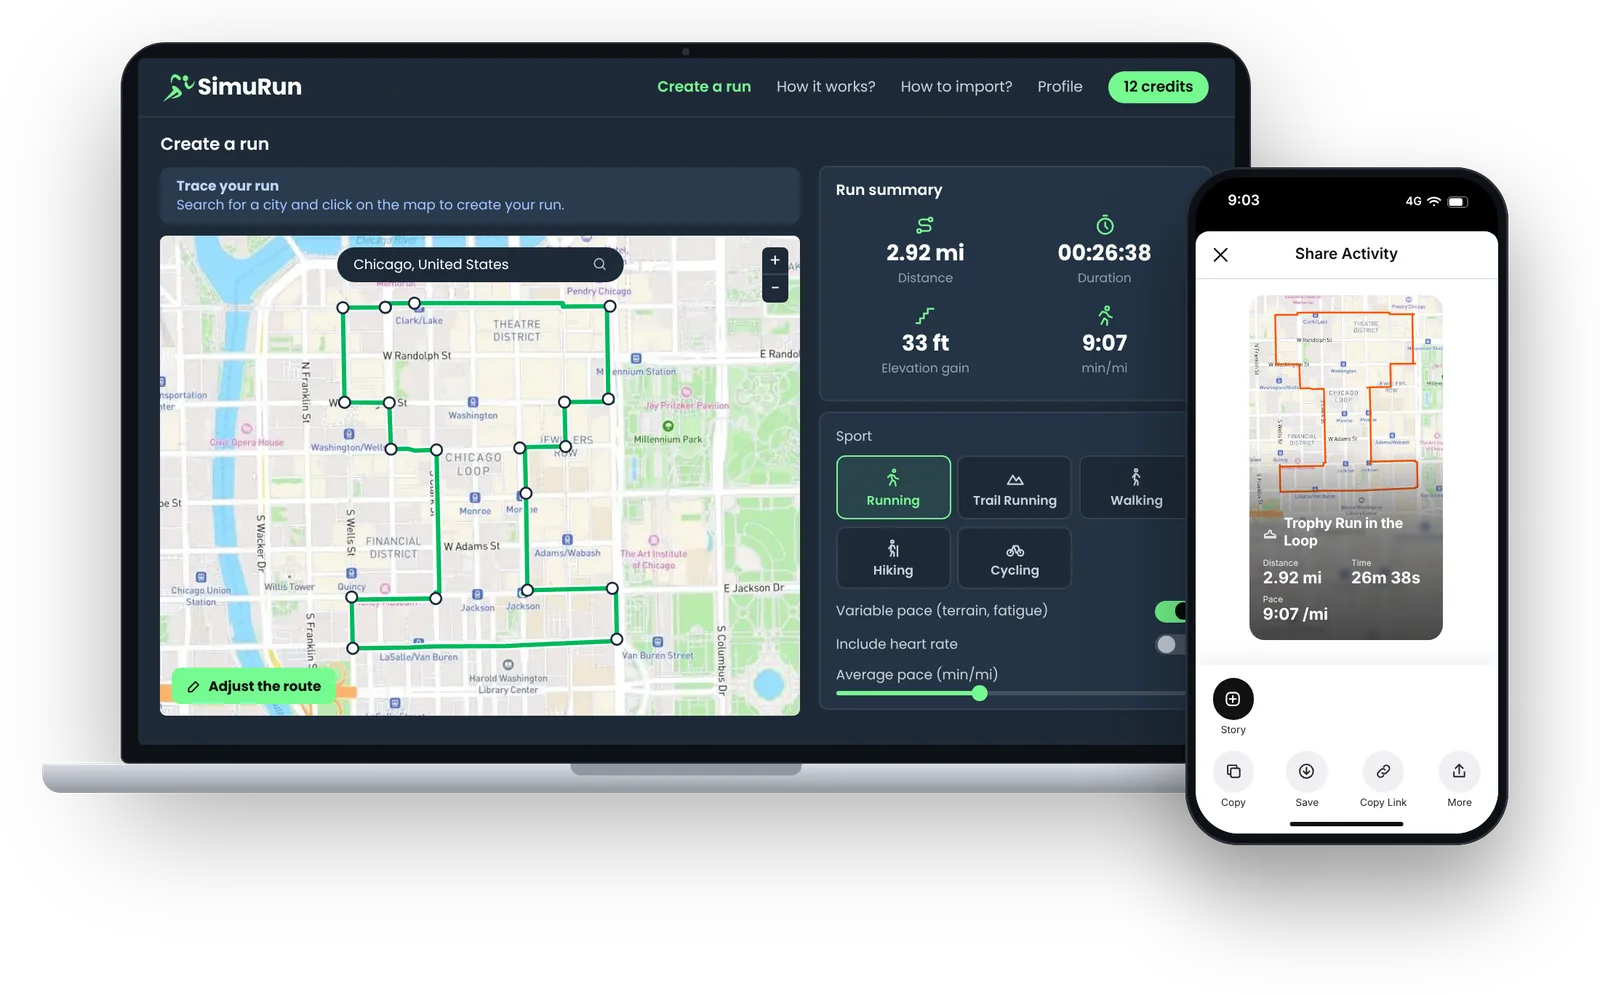
To begin, search for a city, then click on the map to drop your points in order. Then hit “Adjust the route”: SimuRun snaps your line to real streets and trails.
Made a mistake? No worries: undo the last point or clear everything and start over.
Step 2: pick your sport and pace
Choose from five sports: Running, Trail Running, Walking, Hiking, or Cycling. Then pick miles or kilometers and set your average pace.
Next, turn on “Variable pace (terrain, fatigue)”, and your pace changes along the way. Slower uphill, faster downhill, a bit tired at the end. Just like a human.
Step 3: check the run summary
At this point, SimuRun shows distance, duration, elevation gain, and pace. The elevation gain is calculated from your route.
Plus, a run preview shows how your pace and altitude move along the route. Don’t like it? Tweak the route and adjust it again.
Step 4: add the finishing touches
- Heart rate: optional, with an average in bpm.
- Run name: “Mile High tempo” beats “Afternoon Run”.
- Date and start time: Past dates work too.
- Description: A little story never hurts.
Step 5: download your GPX file
Click “Download the run file (1 credit)”. You need a SimuRun account and credits to download, and you only spend a credit when you download.
After that, upload the file to Strava from the website. Every step is in our guide to importing a GPX file into Strava ✅
Real examples and tips for believable stats
Numbers are easier to read with real examples. Here are two runs from our own route gallery.
Two runs, two very different stories 🏆
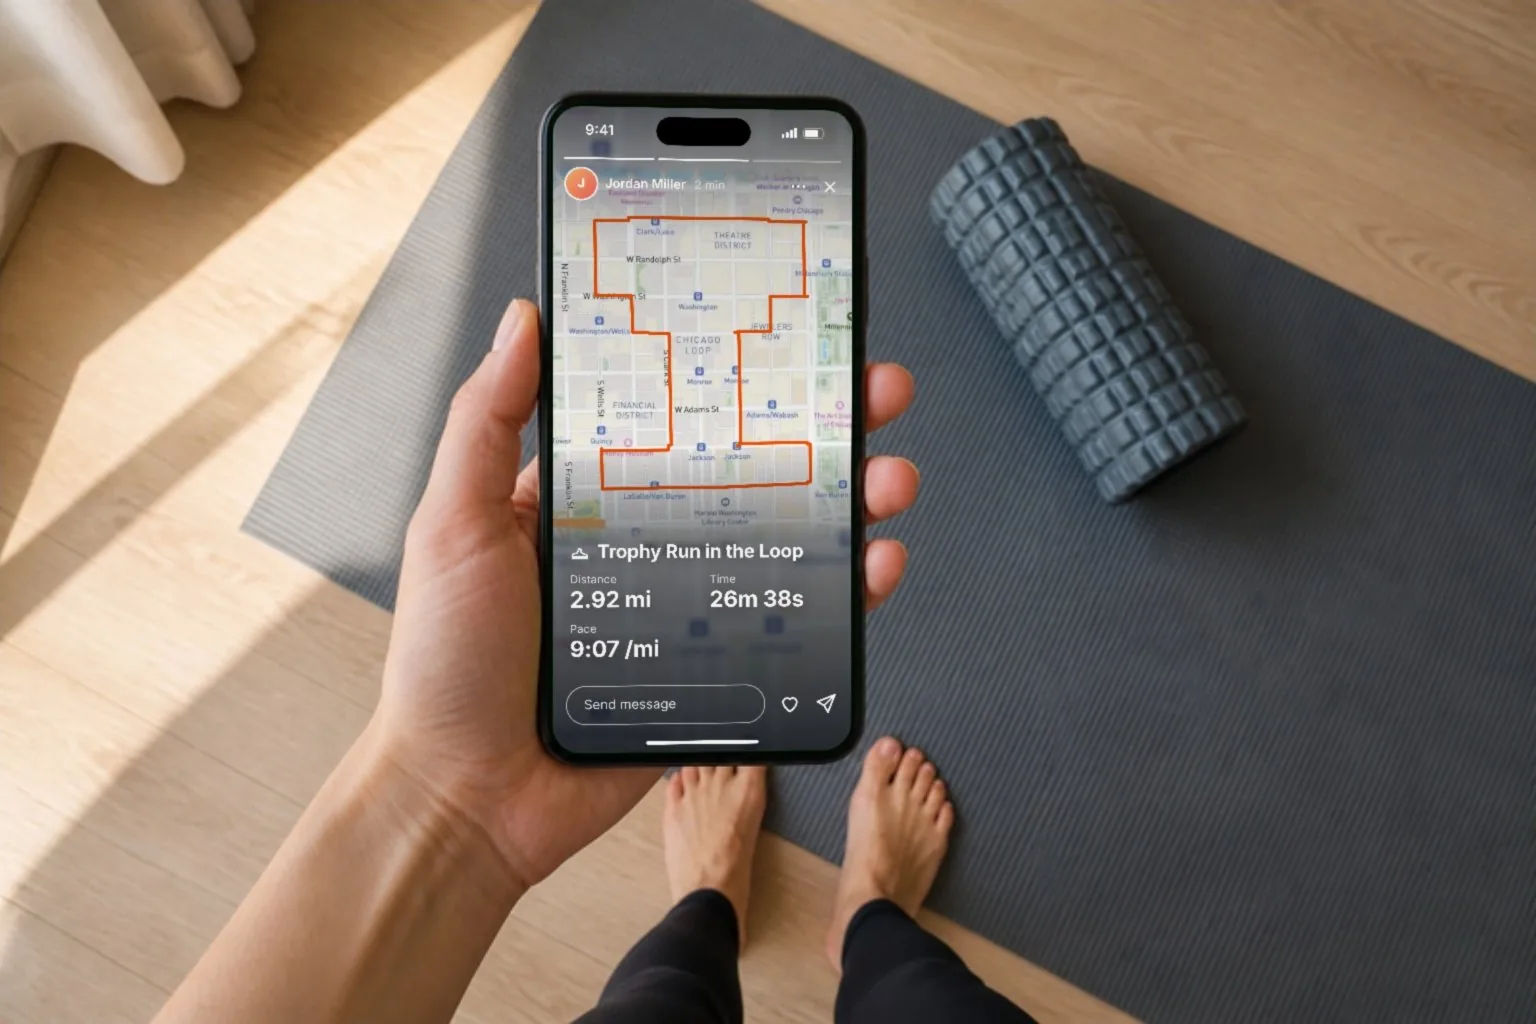
- Trophy Run in the Loop: a trophy drawn through downtown Chicago, 2.92 mi in 26:38 at a 9:07 pace. Short, flat, and perfect for a lunch-break “run”.
- Mission Golden Gate: a San Francisco route, 5.34 mi in 48:41 at the same 9:07 pace. It blends right into a regular week of training.
Same pace, different distances, different times. The math still checks out because each set of Strava fake stats comes from its own route.

Three tips for Strava fake stats that feel human
- Match the pace to the person. If your usual runs sit around 10:00 per mile, a sudden 6:30 looks weird. Believable beats impressive.
- Let the route do the climbing. Want a hillier run? Draw it somewhere hilly, and the elevation gain follows the map.
- Pick a time that makes sense. Morning before work, lunch break, or a Sunday long run: The start time does half the storytelling.
Common mistakes to avoid
- A 3-mile run that lasts two hours. Unless you stopped for brunch, nobody buys it 🥞
- A walking pace on a run, or a running pace on a hike. Pick the sport that matches your speed.
- A route that loops the same block twenty times. Real runners get bored too.
- A heart rate that makes no sense for the effort. If you add it, keep it in a normal range for that pace.
Fix those, and your Strava fake stats will look like just another Tuesday run.
Want to go deeper on speed alone? Read our guide to creating a realistic fake Strava pace. And if you care more about the drawing than the digits, see how to make a fake Strava map 🎨
Simulate ≠ cheat
Above all, let’s keep it clean. Strava fake stats are fun for testing, content, and inside jokes.
- What it is: a creative tool, a test file, a story for your friends.
- What it isn’t: a way to win a race, a challenge, or a segment leaderboard.
Bluff your friends. Never the podium 😉
FAQ about Strava fake stats
Can you fake stats on Strava without a GPS watch?
Yes. Strava accepts uploaded GPX, TCX, and FIT files from its website, so you don’t need a watch. A simulated GPX file from SimuRun works like any other file upload.
How do I upload a GPX file to Strava?
On the Strava website, click “+”, then “Upload activity”, open the “File” tab, and pick your GPX file. Strava explains every method in its official help page on getting activities to Strava.
Where does the elevation gain come from in SimuRun?
From your route. In fact, SimuRun calculates the elevation gain from the path you draw, so it’s not a setting. To get more climbing, draw your route through a hillier area.
Why doesn't my heart rate show on Strava?
By default, Strava hides heart rate on uploaded activities until you allow it. Go to Settings, Data Permissions, Health-Related Data, then “Allow Access”.
Is a fake Strava run the same as a fake Strava screenshot?
No. A screenshot is just a picture, while a GPX file becomes an activity in your app, with a map and stats computed from your route.
Curious what’s inside a GPX file? Check out the official GPX format page.
Are fake stats allowed on Strava?
In short, use it for fun, tests, and content, never for races, challenges, or leaderboards. Check the rules of each platform you use, because that’s on you.
🏁 Conclusion: Strava fake stats that add up
To sum up, good Strava fake stats aren’t about big numbers. They’re about numbers that agree with each other.
Whether you want to:
- test a new app or watch,
- film a fun video,
- or prank your running group,
one route gives you distance, time, pace, and elevation gain that make sense together.
Want the full tour? See how SimuRun works if you want the full tour.
Simulate. Post. Bluff. 😎